What Drives Bitcoin’s Price Up? The 8 Key Factors

📋 En bref (TL;DR)
- Fixed supply : only 21 million BTC will ever exist — programmed scarcity is the foundation of Bitcoin’s value
- Halving : every 4 years, miner rewards are cut in half, reducing new supply and historically preceding every bull run
- Institutional demand : spot Bitcoin ETFs approved in January 2024 attracted over $50 billion in net inflows within a year
- Macro context : monetary policy, interest rates, and global liquidity directly influence appetite for Bitcoin
- Growing adoption : over 500 million crypto holders worldwide, with nations like El Salvador and Bhutan holding BTC in official reserves
- Market sentiment : FOMO, media coverage, social networks, and narratives amplify upward price movements
- Regulation : a clear framework (ETFs, MiCA) reassures investors and stimulates demand
What drives Bitcoin’s price up?
Bitcoin’s price is governed by a fundamental mechanism: the balance between a strictly limited supply and constantly evolving demand. Unlike traditional currencies, which central banks can print in unlimited quantities, Bitcoin is capped at 21 million units. This programmed scarcity, combined with economic, institutional, and psychological factors, creates the conditions for its spectacular rallies.
Bitcoin crossed the $100,000 mark in 2024 and remains above that level in early 2026 — this is no accident. Eight primary factors explain these bullish movements. Here they are, broken down with concrete data.
2x cheaper fees. Up to 6% yield. No seed phrase. Fibo, the wallet you've been waiting for.
Get early access →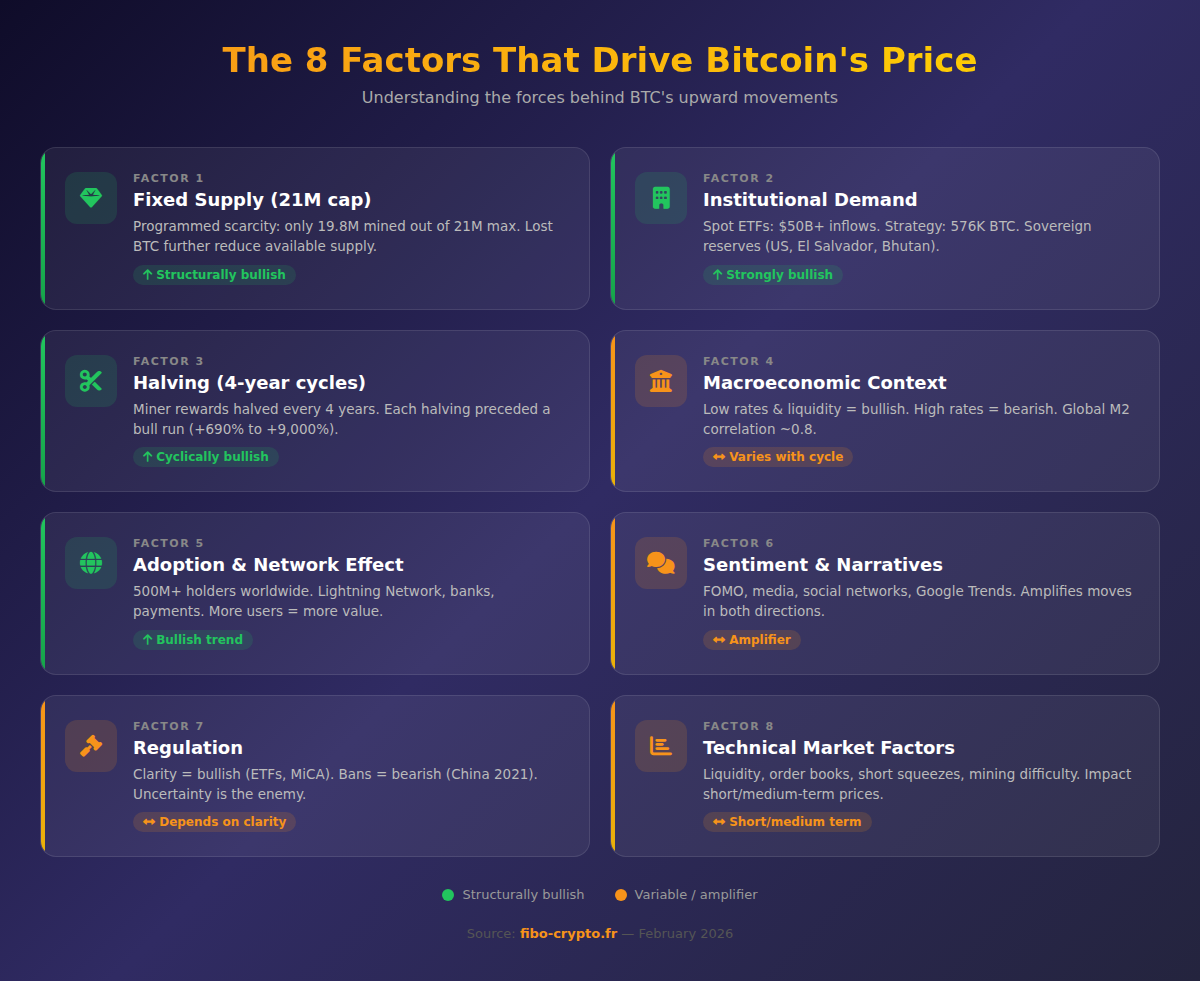
The hard cap: only 21 million BTC
Bitcoin is the first financial asset whose maximum supply is known in advance and immutable: no more than 21 million BTC will ever exist. As of writing, approximately 19.8 million bitcoins have been mined — over 94% of the total supply. The last BTC won’t be issued until around 2140.
This scarcity stands in stark contrast to fiat currencies. Between 2020 and 2022, the US M2 money supply increased by over 40%, diluting the dollar’s purchasing power. Bitcoin, by contrast, follows a decreasing and predictable issuance schedule, which conceptually aligns it with gold — hence its nickname as digital gold.
The stock-to-flow model, popularized by analyst PlanB, measures scarcity by comparing existing stock to the annual flow of new production. After the April 2024 halving, Bitcoin’s stock-to-flow ratio surpassed that of gold, theoretically reinforcing its scarcity premium.
The lost bitcoin dynamic
An estimated 3 to 4 million BTC are permanently lost (misplaced private keys, inaccessible wallets). The truly available supply is therefore well below the 19.8 million in existence, amplifying upward price pressure when demand increases.
Institutional demand: the ETF effect and corporate treasuries
The arrival of institutional investors represents the most significant structural change in Bitcoin’s history. The SEC’s approval of spot Bitcoin ETFs on January 10, 2024, opened the floodgates for capital that had previously been locked out of the crypto market.
Spot Bitcoin ETFs by the numbers
In just over a year, US spot Bitcoin ETFs have accumulated more than $50 billion in net inflows. BlackRock’s iShares Bitcoin Trust (IBIT) became the fastest-growing ETF in history, surpassing $40 billion in assets under management in less than 12 months. Fidelity’s Wise Origin Bitcoin Fund (FBTC) follows with over $10 billion.
These buy flows translate into real demand: every dollar invested in a spot ETF requires the purchase of actual BTC on the market. In other words, ETFs remove bitcoins from circulation, reducing available supply.
Companies accumulating Bitcoin
Strategy (formerly MicroStrategy), under Michael Saylor’s leadership, holds approximately 576,000 BTC — over 2.7% of total supply. Strategy’s model of raising debt to buy Bitcoin has inspired other corporations. Tesla holds roughly 9,700 BTC, Block (formerly Square) invests regularly, and companies like Marathon Digital and Japan’s Metaplanet follow similar strategies.
Government initiatives add to this demand: the United States holds approximately 200,000 BTC seized during law enforcement operations, and the Trump administration established a “Strategic Bitcoin Reserve.” El Salvador and Bhutan also accumulate BTC as national reserves.
FASB fair value accounting
The US Financial Accounting Standards Board (FASB) adopted new rules effective 2025, allowing companies to record Bitcoin holdings at fair market value rather than historical cost. This change eliminates a major accounting disincentive that previously penalized corporate BTC holdings, making treasury allocation to Bitcoin more attractive.
The halving and historical cycles
The halving is a programmed event in Bitcoin’s protocol that cuts miner rewards in half every 210,000 blocks — approximately every four years. This mechanism mechanically reduces the flow of new BTC entering circulation, creating a supply shock.
Bitcoin’s four halvings
Here is the historical record of halvings and their price impact:
- November 2012 (50 → 25 BTC): price rose from ~$12 to over $1,100 within a year (+9,000%)
- July 2016 (25 → 12.5 BTC): price went from $650 to nearly $20,000 by late 2017 (+3,000%)
- May 2020 (12.5 → 6.25 BTC): price climbed from $8,700 to $69,000 in November 2021 (+690%)
- April 2024 (6.25 → 3.125 BTC): price breached $100,000 in December 2024 and remains above that level in early 2026
Correlation is not a guarantee, but the pattern repeats: each halving has preceded a major bull run within 12 to 18 months. The explanation is straightforward — if demand holds steady or grows while new supply is halved, the price must mathematically adjust upward.
The four-year cycles
The crypto market appears to follow roughly four-year cycles tied to halvings: an accumulation phase, a bullish phase (bull run), a peak, and then a correction (bear market) before the next cycle begins. Understanding these cycles is essential for any investor looking to calibrate their strategy.
The macroeconomic backdrop
Bitcoin does not exist in a vacuum — it responds to the same macroeconomic forces as traditional markets while offering an alternative to expansionary monetary policies.
Interest rates and monetary policy
When central banks cut interest rates, the cost of capital decreases and investors seek higher-yielding assets. Bitcoin, considered a “risk-on” asset, benefits from low-rate environments. Conversely, the Fed’s rate hikes between 2022 and 2023 coincided with the crypto bear market.
Since late 2024, the Fed’s rate-cutting cycle has helped sustain the crypto market recovery. The ECB and other central banks have followed similar trajectories, injecting liquidity into the global financial system.
Inflation and currency erosion
Inflation is one of the most powerful narratives in Bitcoin’s favor. When fiat purchasing power declines, the value proposition of a fixed-supply asset strengthens. The global inflation peak in 2022–2023 (US CPI above 9%) paradoxically laid the groundwork for the next bull run by anchoring the narrative of Bitcoin as an “inflation hedge.”
Correlation with global liquidity
Analysts observe a strong correlation between Bitcoin’s price and global liquidity (worldwide M2 money supply). When central banks inject liquidity, a portion of that capital flows into risk assets, including Bitcoin. This correlation — estimated at roughly 0.8 over 12-month periods — partly explains why quantitative easing policies have historically been bullish for BTC.
Adoption and the network effect
The more Bitcoin is used and held, the greater its perceived value becomes — this is the principle of the network effect, similar to what made the Internet and social networks successful.
Adoption by the numbers
According to estimates from Chainalysis and Triple A, over 500 million people worldwide hold cryptocurrency in 2026, up from approximately 300 million at the end of 2022. The number of active Bitcoin addresses exceeds 50 million. Each new participant increases potential demand against a fixed supply.
Nation-state adoption
El Salvador made Bitcoin legal tender in 2021 and continues to accumulate BTC in its national reserves. Bhutan mines Bitcoin using hydroelectric power. The United States, through its strategic reserve of ~200,000 BTC, has legitimized Bitcoin at the sovereign level. Other countries, including the UAE and Paraguay, are exploring favorable frameworks.
Integration into payments
The Lightning Network, Bitcoin’s layer 2 protocol, has dramatically improved payment capabilities: near-instant transactions for sub-cent fees. Companies like Strike, Cash App, and even European banks (BPCE, KBC) are progressively integrating Bitcoin into their product offerings.

Market sentiment and narratives
In a market still young and dominated by retail investors, collective sentiment — optimism, fear, euphoria — plays a major amplifying role in price movements.
FOMO and attention cycles
FOMO (Fear Of Missing Out) is a powerful buying driver. When Bitcoin breaks through psychological thresholds ($10,000, $50,000, $100,000), media attention explodes. Google searches for “Bitcoin” are strongly correlated with price peaks, creating a virtuous cycle: the rally attracts attention, which generates buying, which fuels further gains.
Social media influence
A single Elon Musk tweet in 2021 announcing Tesla would accept Bitcoin triggered a 15%+ surge within hours. Crypto communities on X (Twitter), Reddit, and TikTok amplify bullish narratives. Trends like the 2021 “laser eyes” movement or “HODL” memes create a sense of belonging that discourages selling and encourages accumulation.
Sentiment indicators
The Fear & Greed Index, calculated from volume, volatility, and social trends, oscillates between “extreme fear” (historically a buy signal) and “extreme greed” (overheating signal). Sophisticated investors use these indicators as contrarian timing tools.
The regulatory framework
Regulation can be Bitcoin’s best friend or worst enemy, depending on whether it brings clarity or uncertainty.
Positive regulatory impact
The approval of spot Bitcoin ETFs in the United States in January 2024 is the perfect example of positive regulation — it opened the market to billions of dollars in institutional capital. In Europe, the MiCA regulation (Markets in Crypto-Assets), which took effect in late 2024, created a clear legal framework that reassures investors and businesses alike.
The SEC’s gradual shift from an enforcement-first approach toward constructive rulemaking under the current administration has further boosted market confidence. The bipartisan support for stablecoin legislation (GENIUS Act) and market structure bills reflects a maturing regulatory landscape.
Negative regulatory impact
Conversely, China’s ban on Bitcoin mining and trading in 2021 triggered a temporary 50% crash. Regulatory threats from the SEC against exchanges and crypto projects (Binance, Coinbase cases) create uncertainty and weigh on prices in the short term.
The lesson is clear: it’s not regulation itself that drives prices up or down, but the degree of clarity it provides. A predictable framework attracts capital; uncertainty drives it away.
Technical market factors
Beyond fundamentals, market microstructure — liquidity, order books, leveraged positions — influences price movements in the short to medium term.
Liquidity and order books
Liquidity in an order book determines the magnitude of price movements for a given volume. When liquidity is thin (weekends, holiday periods), a relatively modest buy order can cause a disproportionate price move. “Liquidity zones” identified by traders serve as price magnets.
Short squeezes and liquidations
When a large number of traders have leveraged short positions, a price increase can trigger cascading short squeezes. Short positions are automatically liquidated, generating forced buy orders that amplify the rally. In December 2024, over $2.5 billion in short positions were liquidated within 48 hours as Bitcoin broke through $100,000.
Mining difficulty
Mining difficulty adjusts automatically every 2,016 blocks to maintain an average block time of 10 minutes. When difficulty increases, the cost of producing one BTC rises, creating an economic “price floor” below which miners become unprofitable. After the April 2024 halving, the average production cost is estimated between $40,000 and $60,000, providing price support.
Hashrate as a confidence indicator
The hashrate (total network computing power) reached all-time highs in 2025–2026, surpassing 800 EH/s. A high hashrate means miners are investing heavily in infrastructure — a sign of long-term confidence in the network’s profitability.
How these factors interact
The eight factors described above don’t operate in isolation — they reinforce each other through positive (or negative) feedback loops.
Consider a concrete scenario: the April 2024 halving reduces new supply (factor 1). ETFs continue absorbing BTC (factor 2). The Fed initiates rate cuts (factor 3). The price breaks $100,000 (factor 5 — sentiment). Media covers it extensively (factor 6 — FOMO). Corporations strengthen their reserves (factor 2 reinforced). Short squeezes amplify the rally (factor 7).
It’s this convergence of factors that explains Bitcoin’s parabolic moves. And conversely, when multiple factors reverse simultaneously (rising rates, hostile regulation, negative sentiment), corrections are equally dramatic.
What analysts are forecasting
Analyst forecasts reflect the weight of these fundamental drivers:
- Bernstein targets $150,000–$200,000 by end of 2026, driven by ETF flows and institutional adoption
- Cathie Wood (Ark Invest) maintains a $1.5 million target by 2030, based on corporate treasury adoption
- Standard Chartered forecasts $200,000 in 2026 based on accelerating ETF inflows and US pro-crypto policy
- JPMorgan takes a more conservative stance at $120,000, highlighting residual regulatory risks
These forecasts are not guarantees. Bitcoin remains volatile and unpredictable in the short term. But they illustrate growing institutional confidence in Bitcoin’s long-term fundamentals.
📚 Glossary
- Bitcoin : the first decentralized cryptocurrency, created in 2009 by Satoshi Nakamoto, operating on a peer-to-peer network with a capped supply of 21 million units.
- Halving : a programmed event in Bitcoin’s protocol that cuts miner rewards in half every 210,000 blocks (~4 years), reducing the rate of new BTC issuance.
- Stock-to-flow : a valuation model that measures an asset’s scarcity by comparing existing stock to the annual flow of new production.
- ETF : Exchange-Traded Fund, a publicly traded fund that replicates the performance of an underlying asset. A spot Bitcoin ETF holds actual BTC.
- Bull run : an extended period of rising prices in a financial market, characterized by growing optimism and high buying volumes.
- Bear market : an extended period of declining prices (typically -20% or more from the peak), accompanied by pessimism and capital outflows.
- FOMO : Fear Of Missing Out, the fear of missing an investment opportunity, driving purchases based on emotion rather than analysis.
- Market cap : market capitalization, calculated by multiplying an asset’s unit price by the total number of units in circulation.
- Liquidity : the ease with which an asset can be bought or sold on a market without causing a significant price movement.
- Correlation : a statistical measure of the degree of relationship between two variables. A correlation of 1 means they move perfectly together.
- Mining difficulty : a Bitcoin protocol parameter that adjusts automatically to maintain an average block time of 10 minutes, regardless of changes in computing power.
- Order book : a market’s list of all pending buy orders (bids) and sell orders (asks) at different price levels.
- Digital gold : a nickname for Bitcoin due to its properties of scarcity, durability, and censorship resistance, comparable to those of physical gold.
- Short squeeze : a sharp upward price movement caused by cascading liquidations of short (bearish) leveraged positions, forcing sellers to buy back.
- MiCA : Markets in Crypto-Assets, a European regulation governing digital assets that took effect in late 2024, creating a harmonized legal framework across the EU.
- Lightning Network : a layer 2 protocol built on Bitcoin enabling near-instant and very low-cost transactions, improving the network’s scalability.
- Network effect : an economic phenomenon where a network’s value increases proportionally to the square of its number of users (Metcalfe’s Law).
- Inflation : a general and sustained rise in the price level, leading to a decline in the purchasing power of currency.
Frequently Asked Questions
Why does Bitcoin's price rise after a halving?
The halving cuts the amount of new BTC issued daily in half. If demand remains steady or increases while new supply decreases, the imbalance pushes prices upward. Historically, each halving (2012, 2016, 2020, 2024) has preceded a major bull run within 12 to 18 months.
Do Bitcoin ETFs actually drive the price up?
Yes, because spot ETFs purchase real BTC to back their shares. Every investment inflow translates into a market purchase, removing bitcoins from circulation. Since their January 2024 launch, US spot Bitcoin ETFs have accumulated over $50 billion in net inflows, creating significant buying pressure.
Is Bitcoin a good hedge against inflation?
Bitcoin is designed as a deflationary asset: its supply is capped at 21 million units and its issuance rate decreases over time. Over the long term, it has outperformed inflation. However, its high short-term volatility makes it an imperfect near-term hedge. It’s better understood as a long-term store of value.
How do social media affect Bitcoin's price?
Social media amplify market movements by rapidly spreading information, opinions, and emotions. A viral tweet, an influencer’s post, or a trending narrative can trigger buying waves (FOMO) or panic selling. Google searches for “Bitcoin” are strongly correlated with price peaks.
Can regulation make Bitcoin's price go up?
Absolutely. Clear and favorable regulation — such as the approval of spot ETFs in the US or MiCA in Europe — reassures institutional investors and opens new capital channels. It’s regulatory uncertainty, not regulation itself, that weighs on prices.
Why is Bitcoin's price correlated with global liquidity?
Bitcoin is a liquidity-sensitive asset. When central banks inject money into the economy (quantitative easing, rate cuts), a portion of that capital flows into higher-yield assets, including BTC. The correlation between Bitcoin’s price and global M2 money supply is estimated at approximately 0.8.
What is a short squeeze and how does it push Bitcoin's price higher?
A short squeeze occurs when many traders who bet on a price decline (short positions) are forced to buy back BTC to cover their losses, creating cascading buy orders. This mechanically amplifies the rally — sometimes dramatically, as seen when Bitcoin broke $100,000 in December 2024.
Can Bitcoin keep going up forever?
Bitcoin is a cyclical asset that experiences bull markets and corrections. Its fundamentals — programmed scarcity, growing adoption, institutional integration — support a long-term upward trend. But corrections of 50–80% are an integral part of its history and remain possible.
📰 Sources
This article is based on the following sources:
- Bitcoin Whitepaper – Satoshi Nakamoto (2008)
- BlackRock – iShares Bitcoin Trust (IBIT)
- CoinGecko – Bitcoin Market Data
- MiCA Regulation – Official Journal of the EU
- Chainalysis – Global Crypto Adoption Index
- Glassnode – Bitcoin On-Chain Metrics
Comment citer cet article : Fibo Crypto. (2026). What Drives Bitcoin's Price Up? The 8 Key Factors. Consulté le 21 March 2026 sur https://fibo-crypto.fr/en/blog/what-drives-bitcoin-price-up
The simplest way to buy, swap and manage your crypto
Join the first users and get priority access. No seed phrase, fees 3.5x lower, built-in DeFi yield.
Get early access →