Crypto Technical Analysis: Complete Beginner’s Guide (2026)

📋 En bref (TL;DR)
- Crypto technical analysis studies price charts and volume to predict future market movements.
- Support and resistance are key levels where price bounces or reverses — essential for placing your orders.
- Japanese candlesticks reveal market psychology: learn to read patterns (hammer, doji, engulfing).
- 5 essential indicators: RSI, MACD, Moving Averages, Bollinger Bands, and Volume.
- TradingView is the go-to free tool for analyzing crypto — accessible to beginners and pros alike.
- Always combine multiple indicators — an isolated signal is never reliable. Convergence increases your probability of success.
- Classic mistakes: overtrading, ignoring volume, trading against the trend — avoid them to protect your capital.
Crypto technical analysis is the method used by most traders to anticipate price movements in cryptocurrency markets. Whether you’re a beginner or an experienced trader, mastering the basics of technical analysis is essential for making informed investment decisions. In this comprehensive guide, we explain everything: from fundamental concepts (support, resistance, trends) to the most powerful technical indicators (RSI, MACD, Moving Averages), including reading Japanese candlesticks and using TradingView.
The cryptocurrency market is known for its extreme volatility. Bitcoin can gain or lose 10% in just a few hours. Faced with this volatility, technical analysis provides a structured framework for interpreting price movements and identifying buying or selling opportunities. Unlike fundamental analysis, which evaluates a project’s intrinsic value, technical analysis focuses exclusively on price and volume behavior.
2x cheaper fees. Up to 6% yield. No seed phrase. Fibo, the wallet you've been waiting for.
Join the waitlist →What is Technical Analysis? Complete Definition
Technical analysis (TA) is a method of studying financial markets based on analyzing historical price charts and trading volumes. Its goal: identify recurring patterns to anticipate future market movements.
This approach rests on three fundamental principles established by Charles Dow, the father of modern technical analysis:
1. Price discounts everything
According to this principle, an asset’s current price already reflects all available information: fundamentals, news, market sentiment. No need to look elsewhere — the chart contains everything you need to know.
2. Prices move in trends
Markets don’t move randomly. They follow trends (bullish, bearish, or sideways) that persist until a clear signal indicates a reversal.
3. History repeats itself
Chart patterns repeat because human psychology remains constant. Fear and greed create the same reactions generation after generation. A double top in 2025 looks like a double top in 2015.
In crypto, technical analysis is particularly popular because the market operates 24/7 with sufficient liquidity for technical patterns to form cleanly. Support and resistance levels are often respected with impressive precision, which reinforces the validity of this approach.
Technical Analysis vs Fundamental Analysis: Which Method to Choose?
Before going further, let’s clarify the difference between these two complementary approaches:
Technical analysis studies the “how”: how price evolves, what patterns form, where are the supports and resistances. It answers the question “When to buy or sell?”
Fundamental analysis studies the “what”: what is the project’s real value, its team, technology, adoption. It answers the question “What asset to buy?”
| Criteria | Technical Analysis | Fundamental Analysis |
|---|---|---|
| Time Horizon | Short to medium term | Medium to long term |
| Data Used | Price, volume, indicators | Tokenomics, team, adoption |
| Key Question | When to enter/exit? | What asset has potential? |
| Ideal for | Active trading | Long-term investing |
Our recommendation: Use both! Fundamental analysis to select solid projects, technical analysis to optimize your entry and exit points. An excellent project fundamentally can still lose 50% if you buy at the wrong time.
Technical Analysis Basics: Support, Resistance, and Trends
Before diving into complex indicators, master these three fundamental concepts. They form the foundation of all successful technical analysis.
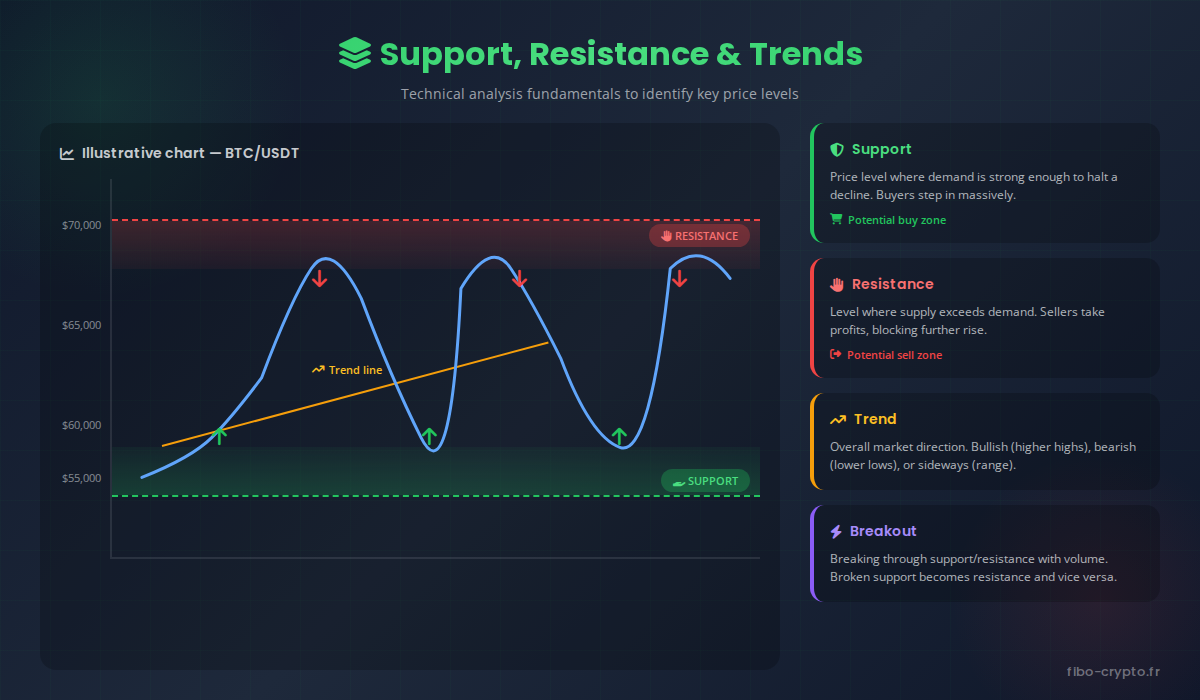
Support: The Price Floor
A support is a price level where demand is strong enough to halt a decline. Concretely, it’s a zone where many buyers place their buy orders, creating a “floor” that prevents the price from going lower.
How to identify support?
- Spot zones where price has bounced multiple times in the past
- The more a support has been tested and respected, the stronger it is
- A broken previous high often becomes new support
- Round numbers ($50,000, $60,000) often act as psychological supports
Strategy: Place your buy orders slightly above identified supports. If support breaks with volume, it’s a bearish signal — the next support becomes your new target.
Resistance: The Price Ceiling
A resistance is the opposite of support: a level where supply exceeds demand, halting the rise. Sellers take profits at these levels, creating selling pressure that prevents the price from going higher.
How to identify resistance?
- Spot previous peaks where price was rejected
- Former accumulation zones often become resistances
- A broken support becomes new resistance (polarity inversion)
- Fibonacci levels (38.2%, 50%, 61.8%) create natural resistances
Strategy: Take partial profits as you approach major resistances. A clean break with significant volume (breakout) is a potential buy signal.
Trends: Following Market Movement
A trend is the general direction in which price moves. There are three types:
Bullish trend (uptrend): Price forms higher highs and higher lows. “The trend is your friend” — trade in the direction of the trend.
Bearish trend (downtrend): Price forms lower highs and lower lows. Ideal period for DCA accumulation if you believe in the project long-term.
Sideways trend (range): Price oscillates between well-defined support and resistance. Strategy: buy at support, sell at resistance.
To draw a trend line, connect at least two lows (uptrend) or two highs (downtrend). The more the line is tested, the more significant it becomes.
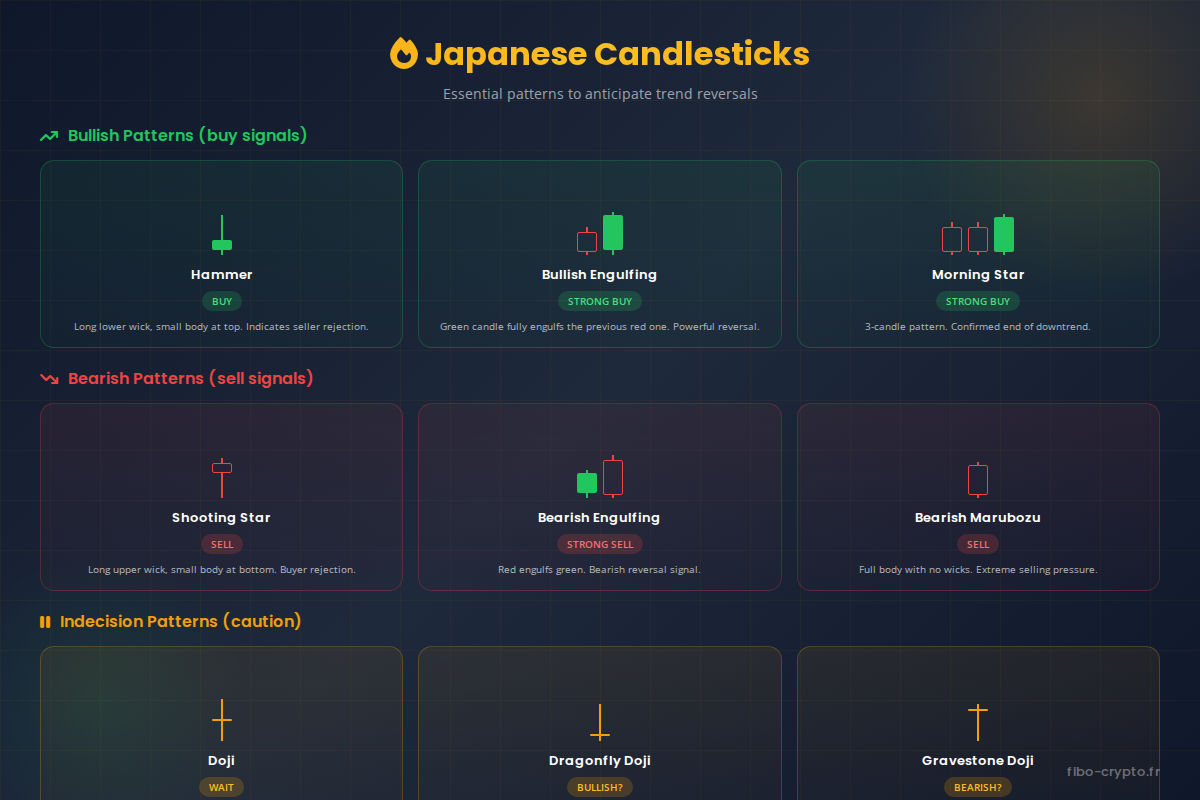
Japanese Candlesticks: Complete Pattern Guide
Japanese candlesticks are the most widely used chart representation in trading. Invented in Japan in the 18th century for rice trading, they reveal market psychology in a visual and intuitive way.
Anatomy of a Candlestick
Each candlestick represents a time period (1 minute, 1 hour, 1 day…) and displays four pieces of information:
- Open: The price at the beginning of the period
- Close: The price at the end of the period
- High: The maximum price reached (upper wick)
- Low: The minimum price reached (lower wick)
Green candle (bullish): Close is higher than open. Buyers won.
Red candle (bearish): Close is lower than open. Sellers won.
Bullish Reversal Patterns
Hammer: Small body at top, long lower wick (2-3x the body). Appears after a decline and signals seller rejection. Buyers regain control. Buy signal if confirmed by the next candle.
Bullish Engulfing: A large green candle completely engulfs the previous red candle. Powerful pattern indicating an abrupt sentiment change. The larger the engulfing body, the stronger the signal.
Morning Star: 3-candle pattern — a red, a small one (indecision), a large green. Very reliable bullish reversal signal, especially after a prolonged downtrend.
Bearish Reversal Patterns
Shooting Star: Inverse of the hammer — small body at bottom, long upper wick. Buyers tried to push price higher but were rejected. Potential sell signal.
Bearish Engulfing: A large red candle engulfs the previous green one. Sellers take control. Time for caution, especially if the pattern appears at resistance.
Bearish Marubozu: Full red body with no wicks. Extreme selling pressure from start to finish of the period. Very bearish signal.
Indecision Patterns
Doji: Open and close at the same level (or nearly). Indicates total indecision between buyers and sellers. Caution: a doji can precede a major reversal, especially after a long trend.
Dragonfly Doji: Long lower wick, no upper wick. May signal a bounce if the doji appears at support.
Gravestone Doji: Long upper wick, no lower wick. May signal rejection if the doji appears at resistance.
Important tip: Never trade a candlestick pattern alone! Always wait for confirmation (next candle) and check the context (overall trend, key levels, volume).
Essential Technical Indicators for Crypto Trading
Technical indicators transform raw price data into actionable signals. Here are the 5 indicators every crypto trader should master:
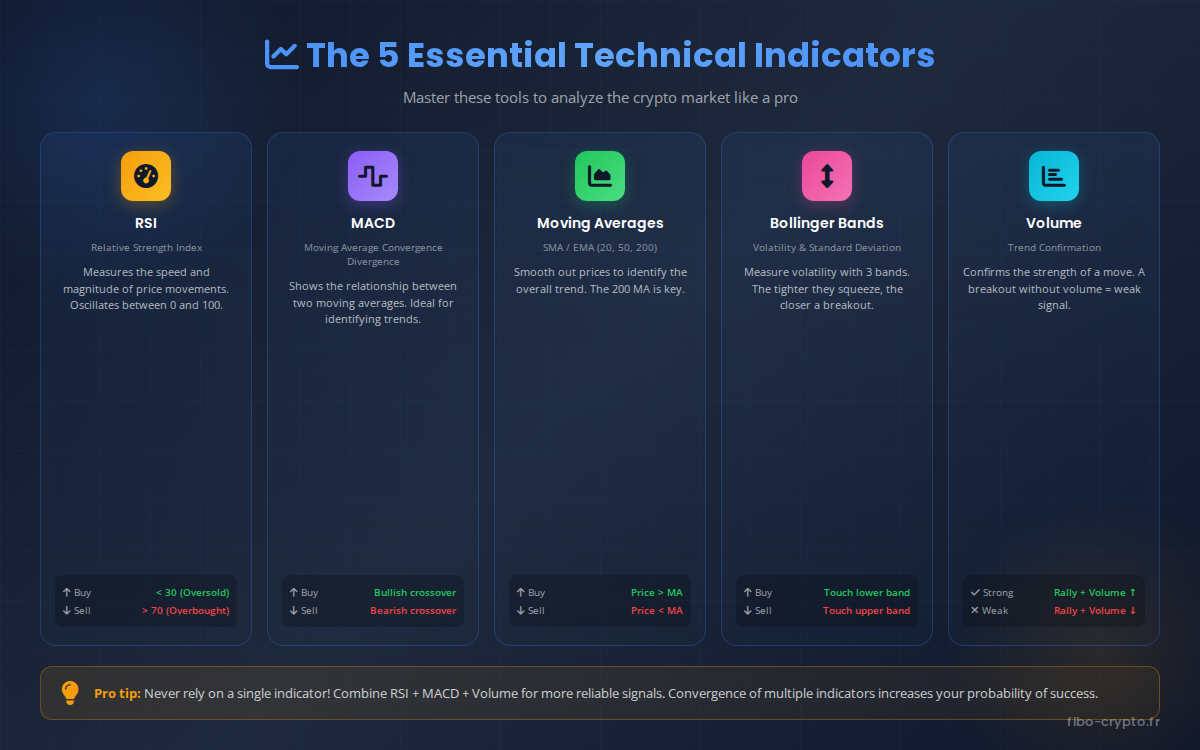
1. RSI (Relative Strength Index) — The Momentum Indicator
RSI measures the speed and magnitude of recent price movements. It oscillates between 0 and 100.
How to read RSI:
- RSI > 70: Overbought zone. Price has risen too fast, correction possible.
- RSI < 30: Oversold zone. Price has fallen too fast, bounce possible.
- RSI between 30 and 70: Neutral zone.
RSI Divergences: This is where RSI becomes truly powerful. A divergence occurs when price and RSI move in opposite directions:
- Bullish divergence: Price makes a new low, but RSI makes a higher low. Potential buy signal.
- Bearish divergence: Price makes a new high, but RSI makes a lower high. Potential sell signal.
Recommended settings: RSI 14 periods (standard). Some traders use RSI 7 for more responsiveness.
2. MACD (Moving Average Convergence Divergence) — The King of Trend Indicators
MACD shows the relationship between two exponential moving averages. It consists of:
- MACD Line: EMA 12 – EMA 26
- Signal Line: EMA 9 of the MACD line
- Histogram: Difference between MACD and Signal
Buy signals:
- Bullish crossover: MACD line crosses the Signal line from below
- Histogram turns from red to green
- MACD crosses the zero line from below
Sell signals:
- Bearish crossover: MACD line crosses the Signal line from above
- Histogram turns from green to red
- MACD crosses the zero line from above
Pro tip: MACD divergences (like RSI) are very powerful reversal signals.
3. Moving Averages (SMA/EMA) — Identifying the Trend
Moving averages smooth out price fluctuations to reveal the underlying trend.
SMA (Simple Moving Average): Arithmetic average of prices over N periods. More stable but less reactive.
EMA (Exponential Moving Average): Gives more weight to recent prices. More reactive to changes.
Key periods:
- MA 20: Short-term trend
- MA 50: Medium-term trend
- MA 200: Long-term trend — THE reference
Strategies with moving averages:
- Price > MA200: Long-term bullish trend — favor buying
- Price < MA200: Long-term bearish trend — maximum caution
- Golden Cross: MA50 crosses MA200 from below — very bullish signal
- Death Cross: MA50 crosses MA200 from above — very bearish signal
4. Bollinger Bands — Measuring Volatility
Bollinger Bands consist of three lines:
- Middle band: SMA 20 periods
- Upper band: SMA + 2 standard deviations
- Lower band: SMA – 2 standard deviations
How to use them:
- Bands widening: Increasing volatility, movement underway
- Bands squeezing: Low volatility, breakout imminent!
- Price touches lower band: Potential buy (oversold)
- Price touches upper band: Potential sell (overbought)
Caution: In a strong trend, price can “ride” along a band for a long time. Don’t automatically sell at the upper band during a bull run!
5. Volume — The Essential Confirmation
Volume represents the number of units traded over a period. It’s the confirmation indicator par excellence.
Golden rules of volume:
- Rally + High volume: Healthy move, the rally is supported by trader interest
- Rally + Low volume: Suspicious move, potential bull trap
- Breakout + High volume: Valid breakout, follow the move
- Breakout + Low volume: Probable false breakout, wait for confirmation
Never trade without checking volume! A technical signal without volume is like a promise without commitment.
How to Read a Crypto Chart on TradingView
TradingView is the go-to platform for crypto technical analysis. Free in its basic version, it offers professional tools accessible to beginners. Here’s how to master it:
Setting Up Your Workspace
- Create a free account at tradingview.com
- Search for your pair: BTCUSDT, ETHUSDT, etc. Choose Binance or Coinbase for liquidity
- Choose your timeframe:
- Scalping: 1m, 5m, 15m
- Day trading: 1h, 4h
- Swing trading: 4h, Daily
- Investing: Daily, Weekly
- Display Japanese candlesticks (candlestick icon in the toolbar)
Adding Your Indicators
- Click on “Indicators” in the top bar
- Search and add: RSI, MACD, Volume (often displayed by default)
- Add moving averages: “MA” then configure the periods (20, 50, 200)
Drawing Your Key Levels
- Horizontal line: To mark supports and resistances
- Trend line: To draw trends (line tool)
- Rectangle: To mark supply/demand zones
- Fibonacci retracement: To identify potential correction levels
TradingView tip: Save your layouts! Create a template with your favorite indicators and apply it to all your charts with one click.
Building Your Technical Analysis Strategy
Having indicators isn’t enough — you need a coherent strategy. Here’s a 5-step framework:
Step 1: Identify the Overall Trend
Before anything, zoom out! Look at the Daily or Weekly chart to understand context. Is price above or below the MA200? Is the trend clearly bullish, bearish, or sideways?
Golden rule: Trade in the direction of the trend. In an uptrend, look for buying opportunities. In a downtrend, be defensive.
Step 2: Spot Key Levels
Draw your major supports and resistances. Identify zones where price has reacted multiple times. These levels will be your decision points.
Step 3: Wait for a Setup
A setup is the convergence of multiple signals:
- Price reaches an important support/resistance
- A candlestick pattern forms (hammer, engulfing…)
- Indicators confirm (RSI oversold, MACD crossing…)
- Volume validates the move
No setup = no trade. Patience is the #1 quality of profitable traders.
Step 4: Define Your Plan BEFORE Entering
For each trade, determine:
- Entry point: At what exact price are you buying?
- Stop-loss: At what level do you cut your losses? (below support)
- Take-profit: Where do you take gains? (at the next resistance)
- Risk/reward ratio: Aim for minimum 1:2 (risk 1 to gain 2)
Step 5: Manage Your Position
Once in position:
- Respect your stop-loss — no negotiating
- Consider taking partial profits (50% at TP1, 50% at TP2)
- Move your stop-loss up to secure gains (trailing stop)
- Don’t modify your plan under emotion
Technical Analysis Mistakes to Avoid
Technical analysis is a powerful tool, but misusing it can be devastating. Here are the classic traps:
1. Overtrading
Trading too often dilutes your capital in fees and multiplies errors. The best opportunities are rare — wait for them.
Solution: Set a maximum number of trades per week. Quality > Quantity.
2. Ignoring Volume
A breakout without volume is probably a false signal. Volume validates movements.
Solution: Systematically add volume to your analysis. No volume, no conviction.
3. Trading Against the Trend
Trying to catch the bottom or top is a losing game. Trends can last much longer than expected.
Solution: “The trend is your friend until the end.” Trade with the trend, not against it.
4. Using Too Many Indicators
A chart overloaded with indicators creates confusion, not clarity. Indicators often contradict each other.
Solution: Limit yourself to 3-4 indicators that you master perfectly.
5. Not Having a Stop-Loss
“It will come back up” are the last words of many traders. A trade without a stop-loss can wipe out your capital.
Solution: ALWAYS define a stop-loss BEFORE entering a position. This is non-negotiable.
6. Letting Emotions Decide
FOMO (fear of missing out), FUD (fear, uncertainty, doubt), revenge trading after a loss… Emotions are the trader’s #1 enemy.
Solution: Follow your plan. If you don’t have a plan, you shouldn’t be trading.
7. Neglecting Risk Management
Even with 70% winning trades, you can lose money if your losses are bigger than your gains.
Solution: Never risk more than 1-2% of your capital per trade. Minimum R/R ratio of 1:2.
Frequently Asked Questions
Does technical analysis really work for cryptocurrencies?
Yes, technical analysis works particularly well on crypto for several reasons: the market is open 24/7 (no overnight gaps), liquidity is sufficient on major cryptos (Bitcoin, Ethereum), and technical patterns are respected with good precision. However, keep in mind that TA is not an exact science — it provides probabilities, not certainties. Always combine multiple signals and manage your risk.
What is the best technical indicator for crypto trading?
There’s no “best” indicator — each indicator has its strengths. RSI is excellent for identifying oversold/overbought zones. MACD is ideal for spotting trend changes. Moving Averages (especially MA200) give trend context. Volume confirms movements. The combination of RSI + MACD + Volume is a powerful trio to start with. The key is mastering a few indicators rather than superficially using many.
How long does it take to master technical analysis?
Expect 6 to 12 months of regular practice to become comfortable with technical analysis. The basics (supports, resistances, candlesticks) can be learned in a few weeks. Mastering indicators takes 2-3 months. But developing the intuition and discipline needed to be profitable takes longer. Tip: start by analyzing charts without trading (backtesting), then move to paper trading before risking real money.
Can technical analysis predict crypto crashes?
Technical analysis can identify warning signs but doesn’t predict crashes with certainty. Indicators like extremely overbought RSI (>80), bearish divergences, or price far from MA200 can signal a likely correction. However, major crashes are often triggered by external events (regulation, hacks, bankruptcies) that TA cannot anticipate. Use TA to manage your risk (stop-loss, position sizing), not to predict the unpredictable.
What timeframe should I use to analyze crypto?
The timeframe depends on your trading style. For scalping: 1 minute to 15 minutes. For day trading: 1 hour to 4 hours. For swing trading: 4 hours to Daily. For long-term investing: Daily to Weekly. Important rule: always analyze multiple timeframes! Start with the higher timeframe (overall trend) then move down to your trading timeframe to refine your entry. For example: Daily for trend, 4H for levels, 1H for timing.
Should I combine technical and fundamental analysis?
Absolutely! Both approaches are complementary. Fundamental analysis helps you select good projects (solid team, innovative technology, growing adoption). Technical analysis helps you optimize entry and exit points. A fundamentally excellent project can lose 50% if you buy in an overbought zone. Conversely, an excellent technical signal on a shitcoin remains dangerous. Combining both maximizes your chances of success.
Do trading bots use technical analysis?
Yes, most trading bots are based on technical analysis. They automatically execute predefined strategies: moving average crossovers, RSI signals, range breakouts, etc. The advantage: they eliminate emotion and can trade 24/7. The disadvantage: they don’t adapt to exceptional market conditions and can accumulate losses during extreme volatility. If you use a bot, understand its strategy and regularly monitor its performance.
How can I avoid false signals in technical analysis?
False signals are inevitable, but you can reduce them: 1) Always wait for confirmation (next candle, volume). 2) Combine multiple indicators — a signal confirmed by 3 indicators is more reliable than an isolated signal. 3) Respect the context (don’t trade against the main trend). 4) Avoid very short timeframes (more noise). 5) Use tight stop-losses to limit the impact of false signals. Accept that some trades will be losing — the goal is to be profitable over time, not to be right every time.
📚 Glossary
- Technical analysis : Method of studying markets based on analyzing price charts and volumes to anticipate future movements.
- Support : Price level where demand is strong enough to halt or reverse a decline. Potential buy zone.
- Resistance : Price level where supply is strong enough to halt or reverse a rise. Potential sell zone.
- Trend : Overall direction of price movement (bullish, bearish, or sideways).
- RSI (Relative Strength Index) : Momentum indicator oscillating between 0 and 100. 70 = overbought.
- MACD : Trend indicator based on the convergence/divergence of two exponential moving averages.
- Moving average (MA) : Indicator that smooths prices to identify trends. SMA = simple, EMA = exponential.
- Bollinger Bands : Volatility indicator composed of three bands based on standard deviation around a moving average.
- Japanese candlestick : Chart representation showing the open, close, high, and low of a period.
- Breakout : Breaking through a support or resistance level, often accompanied by price acceleration.
- Divergence : Situation where price and an indicator move in opposite directions, signaling a potential reversal.
- Volume : Number of units traded over a period. Confirms the validity of price movements.
- Stop-loss : Automatic sell order to limit losses if price reaches a defined level.
- Take-profit : Automatic sell order to secure gains at a predefined price level.
- Timeframe : Unit of time represented by each candle on a chart (1 minute, 1 hour, 1 day, etc.).
📰 Sources
This article is based on the following sources:
- TradingView
- Investopedia – Technical Analysis
- CoinGecko – Crypto Trading Guide
- Binance Academy
- CMT Association
- StockCharts – Chart School
Comment citer cet article : Fibo Crypto. (2026). Crypto Technical Analysis: Complete Beginner's Guide (2026). Consulté le 20 July 2026 sur https://fibo-crypto.fr/en/blog/technical-analysis/
The simplest way to buy, swap and manage your crypto
Join the first users and get priority access. No seed phrase, fees 3.5x lower, built-in DeFi yield.
Join the waitlist →