Bitcoin Crashes to $60,000: Worst Drop Since FTX, Fear Index at Record Low
📋 En bref (TL;DR)
- Bitcoin crashes to $60,000: BTC hit its lowest level since October 2024, before rebounding to $65,000
- Fear Index at 9/100: The fear gauge reaches a level not seen since the 2022 FTX crash
- $2.5 billion liquidated: Leveraged positions were massively liquidated this week
- BlackRock ETF sets record: $10.7 billion in volume in a single day, signaling institutional capitulation
- RSI at 17: The 3rd most extreme oversold level in Bitcoin’s history
- Multiple causes: Hawkish Fed nomination, geopolitical tensions, possible hedge fund blowup
The crypto market just experienced its worst week since the FTX collapse in November 2022. Bitcoin plunged from $122,000 (its all-time high in October 2025) to $60,000 on Thursday — a staggering drop of over 50% in four months. What happened? And more importantly, should you panic or is this an opportunity?
In this article, we analyze in detail the causes of this crash, the data showing the market is in “extreme fear” mode, and what history teaches us about situations like this.
Anatomy of a Crash: Key Figures
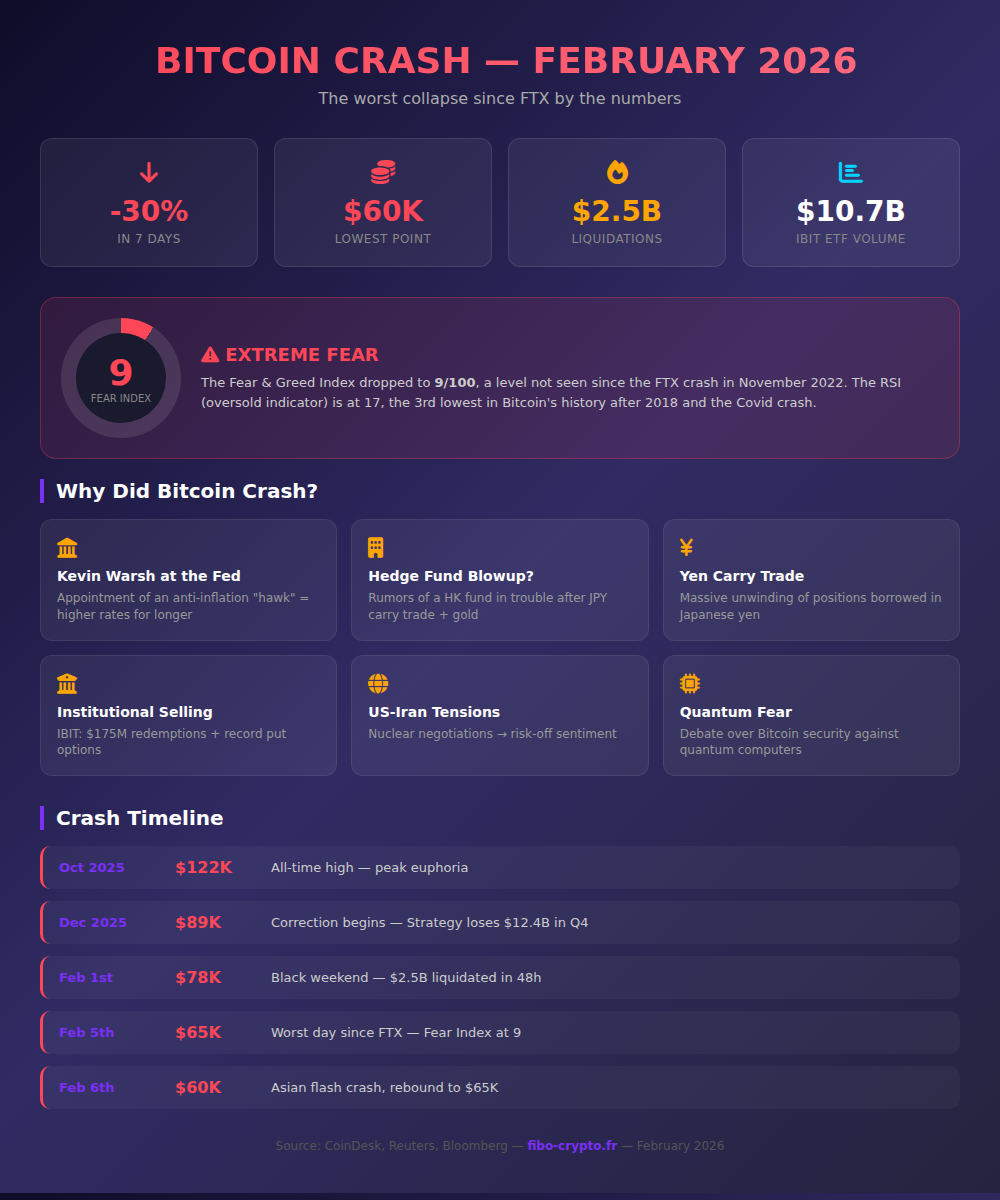
The data speaks for itself. In one week, Bitcoin lost 30% of its value, falling from $87,000 to a low of $60,033 Thursday evening (US time), before rebounding to around $65,000.
Fear & Greed Index at Lowest Since FTX
The Fear & Greed Index, which measures investor sentiment on a scale of 0 to 100, dropped to 9 — a reading categorized as “extreme fear” that hadn’t been seen since the FTX crash.
As a reminder, this index combines several factors: volatility, trading volumes, social media activity, Bitcoin dominance, and Google Trends data related to crypto searches. A score of 9 means the market is in total panic mode.
RSI: The 3rd Most Oversold Level in History
The RSI (Relative Strength Index), a technical indicator measuring whether an asset is overbought or oversold, dropped to 17.6. To put this number in perspective:
- 2018 (bear market bottom): RSI at 9.5 → Bitcoin then quadrupled in 8 months
- 2020 (Covid crash): RSI at 15.6 → Bitcoin went from $3,900 to $65,000 in one year
- 2026 (today): RSI at 17.6 → ?
Historically, such extreme oversold levels have preceded violent rebounds. But as always in finance, past performance is no guarantee of future results.
$2.5 Billion Liquidated
Liquidations reached record levels this week. According to data from CoinGlass and Reuters:
- Thursday alone: $1.5 billion in positions liquidated
- Over the week: more than $2.5 billion
- Since the October peak: approximately $800 billion in market cap wiped out
These forced liquidations create a snowball effect: when the price drops, leveraged positions are automatically sold, which pushes the price down further, triggering more liquidations.
BlackRock ETF: Record $10.7 Billion Volume
BlackRock’s Bitcoin ETF (ticker IBIT) recorded a trading volume of $10.7 billion on Thursday — an absolute record that shattered the previous record of $5.7 billion from November 2025.
This record volume came with several concerning signals:
- Massive redemptions: $175 million withdrawn in a single day
- Record put options: put options (bearish bets) reached a 25 volatility point premium above calls
- ETF price: -13% to $35, its lowest since October 2024
This combination of record volume and price crash is often considered a sign of institutional capitulation — the moment when long-term investors throw in the towel and sell at a loss.

Why Did Bitcoin Crash?
Several factors converged to create this perfect storm. Here are the main hypotheses put forward by analysts:
1. Kevin Warsh’s Nomination to the Fed
Deutsche Bank points to Kevin Warsh’s nomination as the new Federal Reserve chair as the initial trigger. Warsh is considered a “hawk,” favoring high interest rates to fight inflation.
Higher rates are generally unfavorable to risky assets like cryptocurrencies. Investors then prefer to put their money in guaranteed-yield bonds rather than volatile assets.
2. A Hedge Fund in Trouble?
On X (Twitter), several influential traders are discussing the possibility of an Asian hedge fund blowup. Franklin Bi, from Pantera Capital, suggests that a large Asia-based player may have been forced to massively liquidate their positions.
The reconstructed scenario: a fund using leverage on Binance was caught in the yen carry trade unwind, then tried to recover on gold and silver. The failure of this strategy triggered a forced sale this week.
3. Yen Carry Trade Unwind
The carry trade involves borrowing in a low-rate currency (like the Japanese yen) to invest in higher-yielding assets. When the yen strengthens or Japanese rates rise, these positions must be unwound, causing massive selling.
4. US-Iran Geopolitical Tensions
Nuclear negotiations between the United States and Iran resurfaced this week, creating uncertainty in the markets. During geopolitical tension, investors tend to flee risky assets.
5. Quantum Fear
A more unexpected factor: the debate over Bitcoin’s security against quantum computers. Charles Edwards of Capriole reignited concerns by suggesting that falling prices could finally force the ecosystem to take this risk seriously.
6. Strategy (formerly MicroStrategy) Under Pressure
Michael Saylor’s company announced a loss of $12.4 billion in Q4 2025. With 640,808 BTC on the balance sheet and an average purchase price of $74,000, Strategy now has $24 billion in unrealized losses at current prices.
MSTR stock fell 13% on Thursday, fueling fears that the company could be forced to sell some of its bitcoins.
What History Teaches Us
Crashes of this magnitude are rare but not unprecedented. Here’s what happened after previous episodes of extreme fear:
FTX Crash (November 2022)
The Fear Index had dropped to 6. Bitcoin had hit $15,500. A year later, it was back up to $44,000, and had reached $122,000 by October 2025.
Covid Crash (March 2020)
Bitcoin had dropped 50% in two days, going from $8,000 to under $4,000. Within a year, it reached $65,000.
2018 Bear Market
After hitting a bottom at $3,150 with an RSI of 9.5, Bitcoin quadrupled in 8 months to reach $13,800.
The common pattern: moments of extreme fear have historically been attractive entry points for long-term investors. But this doesn’t mean the bottom has already been reached — Stifel predicts a possible return to $38,000.

What Should You Do Now?
Facing a crash of this magnitude, three strategies are available to investors:
1. Do Nothing (HODL)
If you’re a long-term investor with a multi-year horizon, short-term fluctuations shouldn’t affect your strategy. History shows that Bitcoin has always ended up exceeding its previous records.
2. Gradually Reinforce (DCA)
Dollar Cost Averaging involves regularly investing a fixed amount, regardless of price movements. This strategy allows you to smooth out your average purchase price and benefit from dips without trying to “time” the market.
3. Wait for Bottom Confirmation
More cautious traders prefer to wait for technical reversal signals before positioning themselves. A rebound above the 200-day moving average (currently around $58,000) would be a first positive sign.
Important: never invest more than you can afford to lose. Crypto markets remain extremely volatile.

📚 Glossary
- Bitcoin : The first and largest cryptocurrency by market cap, created in 2009 by Satoshi Nakamoto. Operates on a decentralized blockchain.
- ETF : Exchange-Traded Fund, a fund traded on stock exchanges that allows investing in Bitcoin through a regular brokerage account, without directly holding the crypto.
- Liquidation : Forced closure of a leveraged position when the price reaches a certain threshold, to prevent losses from exceeding the invested capital.
- RSI : Relative Strength Index, a technical indicator oscillating between 0 and 100. Below 30, the asset is considered oversold; above 70, overbought.
- Carry trade : A strategy involving borrowing in a low-rate currency to invest in higher-yielding assets.
- DCA : Dollar Cost Averaging, a strategy of regularly investing a fixed amount to smooth out the average purchase price.
- Volatility : A measure of the amplitude of an asset’s price variations. The higher the volatility, the larger the price movements.
Frequently Asked Questions
Why did Bitcoin crash to $60,000?
Several factors converged: the nomination of a “hawkish” Fed chair, rumors of an Asian hedge fund blowup, the yen carry trade unwind, and US-Iran geopolitical tensions. These elements triggered cascading liquidations totaling $2.5 billion.
Is a Fear Index of 9 serious?
A score of 9/100 on the Fear & Greed Index indicates “extreme fear” — a level not seen since the 2022 FTX crash. Historically, these levels have often marked market bottoms, but there’s no guarantee. The market can remain in the fear zone for several weeks.
Is now the time to buy Bitcoin?
Technical indicators (RSI at 17, Fear Index at 9) suggest extreme overselling. Historically, these levels have preceded significant rebounds. However, some analysts (Stifel) predict a possible drop to $38,000. The DCA strategy (regular buying) allows you to position yourself without trying to time the exact bottom.
Why did the BlackRock ETF hit a volume record?
The record volume of $10.7 billion on IBIT reflects institutional capitulation: large investors are selling massively in panic. Combined with $175 million in redemptions and rising put options, it’s a sign that even the “strong hands” are throwing in the towel.
How low can Bitcoin go?
The major technical support is around the 200-day moving average, near $58,000. Stifel predicts a possible return to $38,000 in the worst-case scenario. Conversely, bullish analysts believe the RSI at 17 signals an imminent bottom, as in 2018 and 2020.
Will Strategy (MicroStrategy) sell its bitcoins?
Despite a $12.4 billion Q4 loss and $24 billion in unrealized losses, Strategy hasn’t announced any sales. However, if the price continues to fall toward the $74,000 average purchase price, pressure on the company will increase, which could force a partial liquidation.
📰 Sources
This article is based on the following sources:
- CoinDesk – Bitcoin’s crash to $60,000
- BBC News – Bitcoin hits lowest level since Trump took office
- Reuters – Crypto market volatility triggers $2.5 billion liquidations
- CoinDesk – BlackRock ETF hits $10 billion volume record
- CoinDesk – Strategy posts Q4 loss of $12.4 billion
Comment citer cet article : Fibo Crypto. (2026). Bitcoin Crashes to $60,000: Worst Drop Since FTX, Fear Index at Record Low. Consulté le 9 July 2026 sur https://fibo-crypto.fr/en/blog/bitcoin-crash-60000-fear-index-ftx-february-2026/
The simplest way to buy, swap and manage your crypto
Join the first users and get priority access. No seed phrase, fees 3.5x lower, built-in DeFi yield.
Get early access →