Crypto Cycles: Understanding Market Phases to Invest Smarter
📋 En bref (TL;DR)
- Crypto cycles follow a recurring ~4-year pattern structurally linked to the Bitcoin halving, alternating between accumulation, expansion, distribution, and correction
- 4 phases — accumulation (smart money buys), bull run (FOMO and ATHs), distribution (insiders sell), bear market (capitulation and -70-85% drawdowns)
- Bitcoin halving cuts miner rewards in half every ~210,000 blocks, creating a supply shock that has historically preceded major price rallies within 6-18 months
- Key indicators — MVRV Z-Score, NUPL, Puell Multiple, monthly RSI, and Fear & Greed Index help determine where we stand in the cycle
- Current cycle — post-April 2024 halving, BTC surpassed $100K driven by spot ETF inflows and institutional adoption
- Strategy — adapt your approach to each phase: aggressive DCA during accumulation, gradual profit-taking during bull runs, capital preservation during bear markets
What is a crypto cycle?
A crypto cycle is a recurring period during which the cryptocurrency market moves through distinct phases of growth and decline, following a pattern that has historically repeated approximately every four years. This rhythm is not arbitrary — it is structurally linked to the Bitcoin halving, a programmatic event that cuts miner rewards in half at regular intervals.
Since Bitcoin’s creation in 2009, the market has experienced four major cycles. Each followed a similar blueprint: an extended bottom, an explosive rally, a euphoric peak, and a brutal correction. Understanding these cycles provides an essential framework for making rational investment decisions rather than emotional ones.
2x cheaper fees. Up to 6% yield. No seed phrase. Fibo, the wallet you've been waiting for.
Get early access →Market cycles are not unique to crypto — traditional financial markets also experience alternating bull and bear phases. But in the cryptocurrency space, these cycles are particularly pronounced: the amplitudes are far greater (sometimes +1,000% then -85%), the durations shorter, and the emotional intensity far higher. The relatively nascent market structure, combined with 24/7 trading and global accessibility, amplifies every swing.
The 4 phases of a crypto cycle
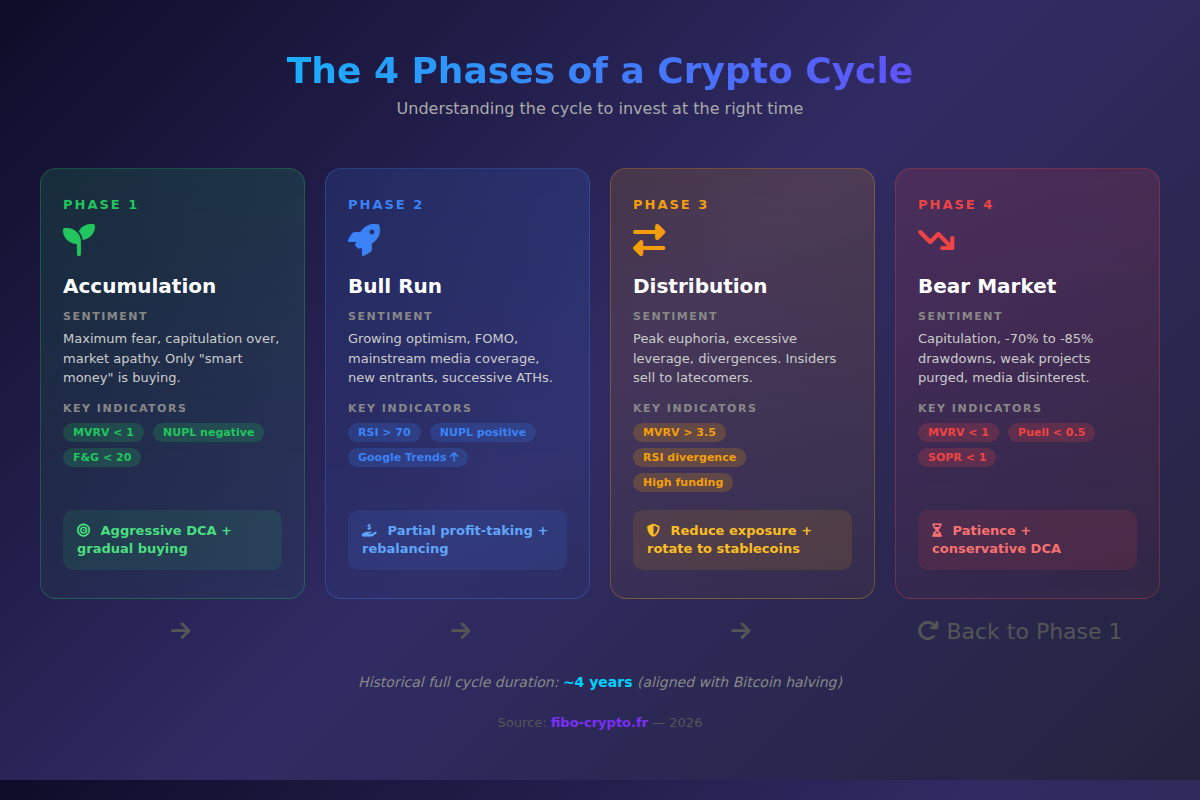
Every crypto cycle decomposes into four distinct phases — accumulation, bull run, distribution, and bear market — that follow each other in a predictable sequence, even though their duration and intensity vary from one cycle to the next.
Phase 1: Accumulation
The accumulation phase corresponds to the market bottom. The preceding bear market has driven away most retail investors, media coverage has evaporated, and the prevailing sentiment oscillates between fear and total apathy. Paradoxically, this is when the best opportunities emerge.
During this phase, experienced investors — often referred to as “smart money” — quietly build positions. Prices trade sideways in a narrow range, trading volumes are subdued, and the market appears lifeless. Beneath the surface, however, fundamentals are improving: technical development continues, adoption grows, and new use cases emerge.
Key indicators for this phase include an MVRV below 1 (meaning the market as a whole is underwater), a Fear & Greed Index persistently below 20, and a normalizing NVT (Network Value to Transactions) ratio.
Phase 2: Bull run (expansion)
The bull run is the phase every investor hopes for. Prices begin rising steadily, first gradually then exponentially. Optimism builds, mainstream media reignites its coverage, and a massive wave of new investors enters the market.
This is the phase of FOMO — the Fear Of Missing Out. Bitcoin sets successive ATHs (All-Time Highs), altcoins surge by hundreds of percent, and the most speculative projects attract enormous capital. Trading volumes skyrocket across exchanges.
From an indicator standpoint, the monthly RSI climbs above 70, NUPL (Net Unrealized Profit/Loss) is firmly positive, Google searches for “buy Bitcoin” spike dramatically, and funding rates on derivatives markets turn sharply positive — a sign of excessive long positioning.
Phase 3: Distribution
The distribution phase marks the cycle’s peak. Euphoria is at its maximum: everyone talks about crypto, non-financial celebrities recommend buying, and the most outlandish price predictions circulate freely (“Bitcoin to $1 million by next month”). But beneath the surface, reversal signals are piling up.
During distribution, experienced investors progressively sell their holdings to late entrants. Price often forms a double top or an extended range near the peak. Bearish divergences appear on the RSI, the MVRV reaches extreme levels (above 3.5), and funding rates remain abnormally elevated — indicating overleveraged long positions.
This phase is the hardest to identify in real time because sentiment remains overwhelmingly positive. Yet it is precisely when you should begin securing gains.
Phase 4: Bear market (correction)
The bear market is the purge phase. Prices collapse 70-85% from the peak, weak projects die, fragile platforms go bankrupt (as we saw with FTX in 2022), and capitulation sets in.
While painful, this phase serves a necessary function: it eliminates speculative excess, cleanses the ecosystem, and sets the stage for the next cycle. Media proclaims “Bitcoin is dead” (for the hundredth time), and mainstream interest evaporates.
Indicator readings during this phase: MVRV falls below 1, the Puell Multiple drops under 0.5 (miners selling at a loss), SOPR falls below 1 (transactions occurring below cost basis), and the Fear & Greed Index remains in “extreme fear” territory for months.
Historical Bitcoin cycles
Since its inception, Bitcoin has completed four major cycles, each characterized by spectacular amplitudes and growing adoption with every iteration.
Cycle 1: 2011-2013
The first true crypto cycle saw Bitcoin climb from $2 to a peak of $1,100 in November 2013 — a rise exceeding 55,000%. The subsequent correction was brutal: -85%, bringing the price down to roughly $170 by early 2015. The market at that time was embryonic, dominated by a handful of enthusiasts and tech-savvy early adopters.
Cycle 2: 2015-2017
Starting from a low around $200 in January 2015, Bitcoin embarked on a climb that took it to nearly $20,000 by December 2017. This cycle was defined by the ICO boom, the emergence of Ethereum as a smart contract platform, and the beginning of mainstream media coverage. The 2018 correction reached -84%, with Bitcoin hitting a floor of $3,200 in December 2018.
Cycle 3: 2018-2021
The third cycle took Bitcoin from $3,200 to an ATH of $69,000 in November 2021. Notably, this cycle featured two distinct peaks ($64,000 in April 2021, then the final top in November), partly due to China’s mining ban causing an intermediate correction. The ensuing bear market saw a -77% decline, bottoming at $15,500 in November 2022 — precipitated by the FTX collapse.
Cycle 4: 2022-2026 (current)
The current cycle began from the $15,500 low in late 2022. The April 2024 halving acted as the expected catalyst, and Bitcoin crossed $100,000 in early 2025 — a landmark psychological level. This cycle stands apart from its predecessors due to the massive influx of institutional investors through spot Bitcoin ETFs (approved in January 2024 in the US), corporate treasury allocation (Strategy, formerly MicroStrategy), and even sovereign interest in Bitcoin reserves.

The halving as a cycle catalyst
The Bitcoin halving is the technical event that structurally drives crypto cycles: by cutting mining rewards in half every 210,000 blocks (approximately every four years), it creates a supply shock that has historically preceded significant price appreciation within 6-18 months.
The mechanism is straightforward. Before the April 2024 halving, miners received 6.25 BTC per validated block. After the halving, this dropped to 3.125 BTC. The daily issuance of new bitcoins was cut in half, while demand — fueled by ETFs, institutions, and retail investors — continued growing.
The historical record speaks for itself:
- November 2012 halving: BTC was ~$12. Peaked 12 months later at $1,100 (+9,000%).
- July 2016 halving: BTC was ~$650. Peaked 17 months later at $20,000 (+3,000%).
- May 2020 halving: BTC was ~$8,700. Peaked 18 months later at $69,000 (+690%).
- April 2024 halving: BTC was ~$64,000. Crossed $100,000 roughly 9 months later. Cycle peak yet to be determined.
A clear trend emerges: returns diminish with each cycle as the market matures, but the rallies remain substantial. The halving does not guarantee an automatic price increase, but it creates supply-demand conditions that have been historically favorable. The Stock-to-Flow model, originally popularized by pseudonymous analyst PlanB, attempted to quantify this relationship, though it has come under criticism for its overly deterministic predictions — Bitcoin did not reach the $100K target during the 2021 cycle as the model suggested.
How to determine where we are in the cycle
Knowing your position within the cycle is crucial for making sound investment decisions. Three categories of indicators — on-chain metrics, technical analysis, and sentiment data — provide a comprehensive picture when used together.
On-chain indicators
Data extracted directly from the Bitcoin blockchain offers unique insights into actual investor behavior:
- MVRV Z-Score: compares market capitalization to “realized” capitalization (the average acquisition cost of all BTC). A score above 7 signals a potential top; below 0, a potential bottom.
- NUPL (Net Unrealized Profit/Loss): measures aggregate unrealized profit or loss across the network. Above 0.75, the market is in euphoria territory; below 0, capitulation territory.
- Puell Multiple: compares daily miner revenue to its 365-day moving average. Below 0.5, miners are in severe distress — a historical buy signal. Above 4, a signal of overheating.
- SOPR (Spent Output Profit Ratio): indicates whether transactions are occurring at a profit or loss. A sustained SOPR below 1 during bear markets signals advanced capitulation.
Technical indicators
- Monthly RSI: the Relative Strength Index on a monthly timeframe is particularly relevant for long-term cycles. Above 90, the market is in extreme overheating; below 30, extremely oversold.
- 200-day and 50-day moving averages: a bullish crossover (golden cross) of the 50MA above the 200MA has historically confirmed the start of bull runs. The inverse (death cross) signals bear market entry.
Sentiment indicators
- Fear & Greed Index: aggregates multiple metrics (volatility, momentum, social media, Bitcoin dominance) into a 0-100 score. Extremes (below 10 or above 90) have historically corresponded to major inflection points.
- Google Trends: search volume for “Bitcoin” or “crypto” is a leading indicator of mainstream interest. Search peaks often coincide with the end of bull runs.
- Funding rates: on derivatives markets, strongly positive funding rates indicate excessive long positioning (overheating signal), while negative rates signal excessive pessimism.
The macro overlay: Fed policy and crypto cycles
Crypto cycles do not exist in a vacuum — they are increasingly correlated with Federal Reserve monetary policy. Quantitative Easing (QE) periods, when the Fed injects liquidity into the financial system, have historically coincided with crypto bull runs (2020-2021). Conversely, Quantitative Tightening (QT) and aggressive rate hikes have coincided with bear markets (2022). Understanding where we stand in the central bank policy cycle adds a valuable macro layer to crypto cycle analysis.

Investment strategies for each phase
The key to successful crypto investing lies not in perfect market timing, but in adapting your strategy to each phase of the cycle.
During accumulation
This is the ideal time to build positions. The recommended approach is aggressive DCA (Dollar Cost Averaging): investing fixed amounts at regular intervals, ideally increasing amounts when prices are especially depressed. Gradual buying allows you to build a significant position without trying to identify the exact bottom.
Asset selection matters critically at this stage: prioritize Bitcoin and Ethereum — which have survived every previous bear market — before considering higher-risk altcoins with strong fundamentals.
During the bull run
Discipline is essential. Define a profit-taking plan in advance: for example, sell 10% of your position each time the price doubles, or rebalance your portfolio toward stablecoins at regular intervals. The investor’s worst enemy during a bull run is greed — trying to sell at the exact top is a fool’s errand.
During distribution
Reduce exposure to your riskiest assets. This is the time to convert a significant portion of your gains into stablecoins or less volatile assets. Be particularly wary of new projects launching at this stage — they are often liquidity traps designed to capture late-cycle retail capital.
During the bear market
Patience is your greatest ally. Resist the temptation to panic sell. If you have available capital, conservative DCA (smaller amounts, wider intervals) allows you to begin repositioning. But capital preservation takes priority: never invest more than you can afford to lose entirely.

Is the 4-year cycle dead?
The arrival of institutional investors and spot Bitcoin ETFs has reignited a long-running debate: will the traditional 4-year cycle persist, or is the market entering a new era?
Several arguments support a structural shift. ETF inflows create constant, regulated demand that could smooth out cycles. Corporate treasury adoption (Strategy alone holds over 200,000 BTC) and sovereign interest change the nature of the buyer base. Figures like Changpeng Zhao (CZ, Binance founder) have publicly stated that the 4-year cycle may be “dead” and that a super-cycle is forming. Standard Chartered has projected Bitcoin reaching $200,000 during this cycle — a target that would represent more modest relative returns but a massive absolute price level.
On the other side, skeptics argue that human psychology — greed and fear — remains unchanged regardless of who the investors are. Institutions are not immune to FOMO or capitulation. Credit cycles, central bank policy shifts, and macroeconomic shocks continue to exert powerful influence on all risk assets, crypto included.
The truth likely lies somewhere between: cycles will persist, but they may become less violent (corrections of -50% instead of -85%) and potentially longer. The halving remains a fundamental mechanism encoded in Bitcoin’s protocol, and as long as it exists, it will continue exerting structural upward pressure on price.
What’s different this cycle is the depth of institutional infrastructure: regulated custody, ETFs, futures markets, and options provide tools that did not exist even two years ago. Whether this changes the cycle’s fundamental character or merely modulates its expression remains the key question for 2026 and beyond.

Common mistakes to avoid
Understanding cycles is necessary but not sufficient — you also need to know the classic traps that ensnare investors during every iteration.
- Trying to time the market: attempting to buy the exact bottom and sell the exact top is an illusion. Even the best analysts cannot do it consistently. A disciplined approach (DCA + gradual profit-taking) nearly always outperforms market timing over a full cycle.
- Selling too early or too late: fear of losing gains pushes investors to sell too early during bull runs, while greed causes them to hold too long through distribution. Set your targets in advance and stick to them mechanically.
- Ignoring fundamentals: relying solely on market “sentiment” or price predictions without understanding underlying mechanisms (halving, adoption metrics, development activity) is a recipe for poor outcomes.
- Overvaluing prediction models: models like Stock-to-Flow, the Bitcoin Rainbow Chart, and PlanB’s projections are analytical tools, not crystal balls. They provide a framework for thinking, but should never be treated as certainties. The S2F model, for instance, predicted $100K+ during the 2021 cycle — it took until 2025 for that target to be reached.
- Neglecting risk management: never invest your entire capital at once, always maintain a cash reserve, and avoid leverage in early-cycle stages. Capital preservation trumps profit maximization in the long run.
- Confusing this cycle with previous ones: each cycle has unique characteristics. The ETF-driven 2024-2026 cycle behaves differently from the ICO-driven 2017 cycle or the DeFi-driven 2021 cycle. Use historical patterns as a guide, not a script.
📚 Glossary
- Crypto cycle : a recurring period of approximately 4 years during which the cryptocurrency market moves through successive phases of accumulation, expansion, distribution, and correction.
- Halving : a programmed event in the Bitcoin protocol that cuts mining rewards in half every 210,000 blocks (~4 years), reducing the rate of new supply issuance.
- Bull run : a sustained period of rising prices characterized by growing optimism, new investor inflows, and successive all-time highs.
- Bear market : a prolonged period of declining prices, typically featuring 70-85% drawdowns from the peak and widespread fear and capitulation.
- ATH : All-Time High — the highest price ever reached by an asset. Each crypto cycle has historically produced a new Bitcoin ATH.
- Correction : a significant price decline (typically exceeding 20%) following a rally, which may occur within a bull run or mark the beginning of a bear market.
- Accumulation : the cycle phase where prices are at their lowest and informed investors gradually build positions before the next rally begins.
- Distribution : the cycle phase marking the peak, where experienced investors sell their holdings to late-arriving market participants.
- MVRV : Market Value to Realized Value — an on-chain metric comparing market capitalization to realized capitalization (the average cost basis of all BTC in circulation).
- RSI : Relative Strength Index — a technical indicator measuring the speed and magnitude of price movements on a scale of 0 to 100.
- Fear & Greed Index : a composite crypto sentiment indicator ranging from 0 (extreme fear) to 100 (extreme greed), based on volatility, momentum, and social data.
- DCA : Dollar Cost Averaging — an investment strategy of investing fixed amounts at regular intervals regardless of price, reducing the impact of volatility.
- Capitulation : the moment when investors sell en masse, accepting heavy losses — often marking the absolute bottom of a bear market.
- FOMO : Fear Of Missing Out — the anxiety of missing an investment opportunity, a dominant sentiment during bull runs that drives impulsive buying.
- Smart money : institutional or experienced investors who tend to buy during accumulation and sell during distribution, acting contrary to prevailing sentiment.
- Stablecoin : a cryptocurrency pegged to a stable asset (typically USD), used as a safe haven during market correction phases.
Frequently Asked Questions
How long does a crypto cycle last?
Historically, a complete crypto cycle spans approximately four years, driven by the Bitcoin halving that occurs every 210,000 blocks. However, the exact duration of each phase varies: the 2022 bear market lasted roughly one year, while the 2020-2021 bull run extended over nearly two years. With growing institutional participation and ETF infrastructure, some analysts believe future cycles may stretch longer as extreme volatility gets dampened.
Are we currently in a bull run (2026)?
As of early 2026, the market exhibits several characteristics of an advanced bull run. Bitcoin crossed $100,000 following the April 2024 halving, spot Bitcoin ETFs are recording record inflows, and institutional adoption is accelerating. On-chain indicators (MVRV, NUPL) are in positive territory without reaching extreme levels, suggesting the cycle may have further room to run. However, caution remains warranted — every cycle eventually reaches a peak, and the timing is never certain.
How can I tell where we are in the cycle?
Combine multiple complementary indicators: MVRV Z-Score and NUPL for on-chain analysis, monthly RSI and moving average crossovers for technical analysis, and Fear & Greed Index with Google Trends for sentiment. No single indicator is sufficient, but their convergence provides reliable signals. Free tools like LookIntoBitcoin and Glassnode’s public dashboards offer access to these metrics.
Will Bitcoin's 4-year cycle continue?
The halving is hardcoded into Bitcoin’s protocol and will continue occurring until the last bitcoin is mined (around 2140). As long as this mechanism exists, it creates a recurring supply shock that influences cycles. However, the impact may diminish over time as mining rewards represent an increasingly smaller fraction of total supply. ETFs and institutional adoption may also modify the dynamics, but cycles of human psychology (fear and greed) will persist.
When should I sell my crypto?
Rather than attempting to sell at the exact top, implement a gradual profit-taking strategy. Define thresholds in advance (e.g., sell 10-20% at each price doubling) and monitor overheating indicators: MVRV above 3.5, monthly RSI above 90, bearish divergences on charts, extreme funding rates. When multiple signals converge, accelerate your profit-taking pace. The goal is not perfection — it’s capturing a meaningful portion of the upside while protecting gains.
Can you make money during a bear market?
Yes, but the strategies differ fundamentally. DCA during bear markets allows you to accumulate at depressed prices for the next cycle — historically the single most profitable approach. Some traders use short selling, but this is risky and best left to professionals. Others generate yield through staking or stablecoin lending protocols. The essential bear market principle is capital preservation and patience.
How do ETFs change crypto cycle dynamics?
Spot Bitcoin ETFs, approved in the US in January 2024, represent a structural shift in how capital flows into crypto. They provide regulated, familiar access for institutional investors and retirement accounts, creating consistent demand that didn’t exist in previous cycles. However, ETFs can also amplify selling pressure during downturns as institutional investors rebalance portfolios. The net effect appears to be smoother cycles with reduced but still significant volatility.
Will the 2024 halving have the same effect as previous ones?
The April 2024 halving has already produced visible effects, with Bitcoin surpassing $100,000 within months. However, each cycle shows diminishing returns (from +9,000% after the first halving to +690% after the third). The fourth cycle is expected to follow this trend with significant but potentially less extreme gains. The unprecedented factor of spot ETF inflows provides an additional bullish catalyst that could extend the duration of the current bull phase.
📰 Sources
This article is based on the following sources:
- Glassnode Studio
- LookIntoBitcoin
- CoinMetrics
- PlanB – Stock-to-Flow Model
- Alternative.me – Fear & Greed Index
- Bloomberg Crypto
Comment citer cet article : Fibo Crypto. (2026). Crypto Cycles: Understanding Market Phases to Invest Smarter. Consulté le 21 July 2026 sur https://fibo-crypto.fr/en/blog/crypto-cycles-guide/
The simplest way to buy, swap and manage your crypto
Join the first users and get priority access. No seed phrase, fees 3.5x lower, built-in DeFi yield.
Get early access →